
Urban Institute: Mapping America's Futures - Test Different Scenarios to See The Affect on Population Changes
by Trends Staff
One thing we can likely all agree on halfway through the year 2020 is very little appears average. Population growth or contraction is estimated using a variety of predictable variables so from one year to the next, there are not a lot of surprises. Over a decade, the increasing amount of time makes estimating population changes more difficult.
The Urban Institute’s Mapping America’s Futures allows you to change a few variables to see how the overall population might be affected.
The map begins with average rates and All Ages and Races. More specifically, options include possible scenarios of Low, Average, or High rates for Births, Deaths, and Migration. Map filters include four age groups (0-19, 20-49, 50-64, and 65+) and All Ages, as well as by four race categories (White, Black, Hispanic, and Other).
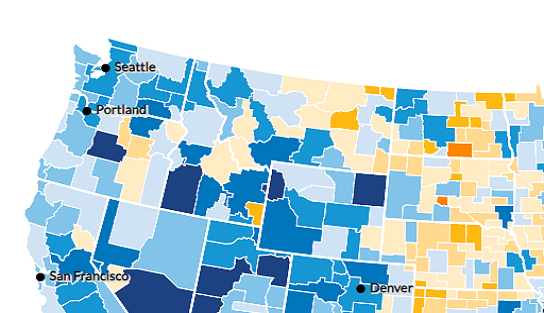
Commuting Zones (CZ) are unique, often crossing county and even state boundaries. CZ’s were created to best reflect local economies regardless of traditional geographical borders. There are 740 unique CZ’s offered in this tool.
Select an area by clicking on the map. This zooms into the selected CZ or state. Scroll down below the map to see age and race detail, and further down to see a breakdown of 18 unique age groups by race. Changes occurring from 2000 to 2010 are actual while estimating each decade through 2030.
The Kennewick Area CZ includes Benton, Columbia, Franklin, and Walla Walla Counties in Washington State and Morrow and Umatilla Counties in Oregon. One highlight of the Kennewick Area CZ is the projected population growth of 141,039 residents, or by 34.84% from 2010 to 2030.
While this tool was available before COVID-19, it can perhaps still inform by selecting Low for Births and Migration and High for deaths. However, we do not know what the final impact of the virus on the typical population changes occurring over a decade.
Yet, demographers write that due to the impact of COVID-19, U.S. birth estimates for 2021 and the foreseeable future, might see as many as one-half million fewer births annually. Ultimately, only time will provide answers to the overall impact, but the Mapping America’s Futures tool might provide us a sneak-peak more important now then when the Urban Institute released this tool a few years ago.
But the big question remains whether the larger (over 1 million) metro areas will change from typical population growth to a decrease, or if their smaller and mid-size counterparts start to see larger than predicted growth.