By Dr. Patrick Jones
Population is up but the count of the men and women in blue is down. What’s happening to law enforcement in the two counties?
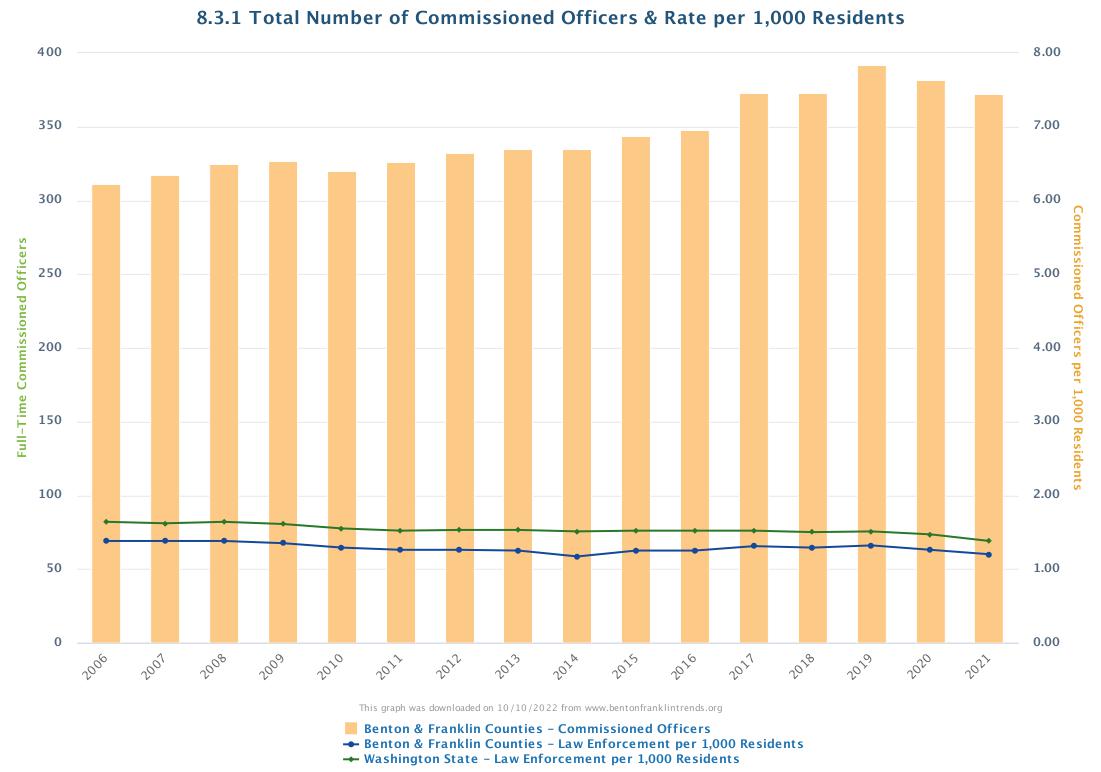
The total of commissioned officers in 2021 from all jurisdictions in the two counties was 372, viewable in Trends 8.3.1. This is down from 2019 peak of 392. Among its many effects, has the pandemic delivered a gut punch to law enforcement staffing, too?
Longer term, the number of officers has grown. Over the past decade (2012-2021), the gain over all the jurisdictions in the two counties was 40 officers, or 12%. This pace still lagged the population percentage gain over the same period, as seen in Trends 0.1.1, of 17%.
As the measure tracking officer numbers shows, there have consistently been fewer officers per resident here than in the state over the past quarter century. In 2021, the average “coverage rate” over all jurisdictions in the two counties: 1.20 per 1,000 residents. In contrast, the Washington average was 1.38. That is a gap of 13% to the state, about equal to the size of the gap over the past two decades.
This rate puts the greater Tri Cities in the middle of law enforcement coverage among eastern Washington metros. At the top for 2021 is Grant County, with 1.57 officers per 1,000 residents. Spokane County jurisdictions show the fewest, at 1.17 per 1,000 residents. In between are the others, led by Walla Walla.
Headcount is one way of measuring the importance a community places on law enforcement. Another is dollars spent per capita. Benton Franklin Trends covers this in indicator 8.3.2. It’s easy to see that, in contrast to headcount, expenditures have increased on a per capita basis. In other words, dollars allocated to law enforcement have are more than keeping up with population growth.
In fact, over the decade 2011-2020, these expenditures have gone up a little more than 40% in the two counties. As with head counts, the current amount of $258 per capita puts the two counties in the middle of metro areas in WA for 2020. Currently spending the most is Spokane, at $273. The area spending the least per resident covers all jurisdictions in Yakima County, at $224 per capita. And as indicator 8.3.2 clearly shows, residents in the greater Tri Cities don’t pay as much per capita as the average Washingtonian. In 2020 the gap amounted to about $47/capita.
Considering relative incomes, however, these results are not surprising. As affluent as the Tri Cities population is relative to the rest of eastern Washington, it still lags behind the state by measures such as per capita income (Trends 3.1.1) or median household income (Trends 3.1.2). When law enforcement expenditures are placed on an equal dollar footing with the state, residents here actually outspend the state! In other words, as a share of their pocketbook, Tri Citians spend slightly more on law enforcement than the average Washingtonian. The difference in 2020: 0.53% here vs. 0.46% statewide.
The fundamental question for policy makers: is this commitment enough to ensure the safety of all residents in the two counties?
Trends indicator 8.1.2, tracking property crimes, displays generally a favorable climate until the past two years. Overall property crime was consistently on a decline from 1995 through 2018. Property crime rates fell continuously to rates far below Washington averages and below the U.S. rate. Then the pandemic hit and rates in 2020 and 2021 climbed to heights not seen since a decade ago.
The story is a bit different for violent crimes in the greater Tri Cities, as tracked in Trend 8.1.3. Here, too, the long-term story is one of a decline, with 2015 showing as the year with the lowest rate over the last quarter century. As with property crimes, the last few years mark a sharp reversal from this trend, with the current rate climbing to the values of over a decade ago. If there is any solace to this story of violent crime in the two counties, it is that rates here have been consistently lower than those of the U.S. and the state.
How big a law enforcement force does a community need? Equivalently, how much should the two counties, in aggregate, spend on law enforcement? To answer that question, it’s helpful to examine whether more men and women in blue impact outcomes, be they violent or property crime rates.
The answer based on a correlation of data in Trends 8.3.1 (number of officers) and violent crime rates, over the interval 2011-2021, is, likely not much. The two indicators show a very low (about -.02) correlation. (A correlation coefficient runs from -1.0 to 1.0, with zero indicating no movement together of the two trends.)
The answer, however, based on a correlation between the count of commissioned officers and property crime rates over the same interval is yes, apparently quite a lot. The correlation coefficient for the two is -0.65. Or a 10% increase in the number of commissioned officers is associated with a 6.5% decrease in the property crime rate. Note that we cannot state definitively that an increase in officers leads to a decrease in property crime. Correlation is not causality.
Nonetheless, we can state that there is a strong association with the number of commissioned officers and property crime, a much more common occurrence than violent crime. Local decision-makers might conclude that more men and women in blue would, in fact, help tamp down crime. Of course, before committing more dollars to public safety, it’s helpful to ask how low would residents like to see their property crimes rates go? As they were in 2018? Lower still?
The strong correlation gives hints about likely effects. Assuming that elected officials opt for higher law enforcement numbers, county and cities’ budgets will need, of course, to find incremental treasure to spend.