
Establishing a Retirement Plan
by Trends Staff
Have you established a retirement plan yet? A USA Facts article elaborated and visualized a decline in the number of American households that have defined a benefit plan. The article includes various interactive graphs showing the amount of money different age groups hold as a percentage.
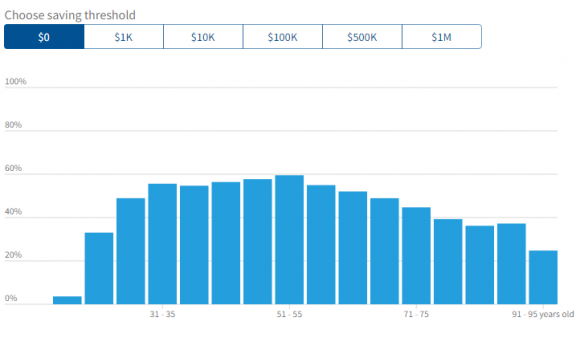
How much savings should people have in their retirement account? $1,000? $10,000? $100,000? Regardless of the response, the first graph shows only 53% of Americans between the ages of 56-60 have more than $1,000 saved for retirement. Additionally, only 49% of Americans between the age of 56-60 have more than $10,000 saved for retirement. Furthermore, only 29% of Americans within the same age group have more than $100,000 saved for retirement. Choosing different saving thresholds allows you to see the percentage of Americans, by age group, who have a certain amount of money saved for retirement.
The following graph also allows users to choose a saving threshold ranging from $0 to $1 million. It displays four different graphs based on the type of account such as the following: retirement savings, checking and savings, financial assets, and net worth. In the United States, households near the age of retirement have lower percentages of people with more than $100,000 in each account. The last interactive graph provides a better understanding of where we each stand compared to different American households. The median household between the ages of 35 to 39 years old saved $2,500 in retirement savings, $3,000 in checking and savings, $14,000 in financial assets, and a net worth of $49,000. Cursoring to the graph reveals personal comparisons to American households based on a designated age, income, and value of net worth, financial assets, retirement savings, or checking and savings.
A trend is seen throughout all graphs shown: American households have decreasingly prioritized saving for retirement regardless of age group.