
U.S. Census: Young Adults and Higher Education - Exploring Higher Education Trends and Employment Prospects
by Ryan Kempffer - Trends Student Employee
Every aspect of life revolves around the act of learning. First, we learn to walk, then we learn to read. Eventually, between the ages of 18 and 34, young adults often choose to take an additional step to further their education.
This visualization,Young Adults and Higher Education, uses 2017 American Community Survey (ACS) data to analyze gender income potential, and how the varying fields of study translate to occupations.
As the visualization shows, the human desire to learn characterizes all genders. In 2017, of all young adults in the United States, 20.9% of women and 16.9% of men had attained a bachelor’s as their highest degree. The visualization also showcases how these statistics can change over time. For example, 2006 saw a total of 17.3% of Women, and 13.5% of Men with a bachelor’s as their highest degree. This equates to a 3.6% and 3.4% total education increase over ten years, for women and men, respectively.
This visualization also provides income comparisons, per state, based on different levels of education completed. As our economy increasingly moves to a knowledge-based one, personal income becomes more tied to education level. In 2017, Washington state young adults that only had a high school diploma earned a median income of $31,431. Those whose highest degree was a bachelor’s earned a median income of $55,871. Those that had any degree above a bachelor’s earned a median income of $76,509. This is a spread of $45,078 between the lowest and highest median incomes by education.
Wages are tied to a certain extent, to specific occupations. The ACS survey tracks thirteen different degree options, ranging from business, engineering, literature and education. Each graduate’s occupation is mapped to a field of study.
For example, of all the degrees, Business was the most common degree type in 2017, accounting for 18.8% of all bachelors awarded. Of all students that held a business degree, 44.8% were employed in business, management, or finance. As the graphic shows, just 0.1% of business graduates were employed in farming or forestry operations. It makes sense, as good curriculum is designed to best prepare the student for a career in that specific field of work.
The connecting of major with its most popular occupations, showing the overall percentage of degree holders, as well as earnings by occupation for each state should help to inform any student facing the declaration of a major.
-----
Vulnerability of Cities in Washington State to COVID-19: Data Interactive by the Association of Washington Cities
by Trends Staff
As you can imagine, there are countless data interactives on COVID-19 – we’ve shared them as well and will continue to do so only if we believe they are helpful to spreading the facts to help you make informed decisions. Why are data interactives so helpful?
1) They allow you to get as much or as little information as you want in one place.
2) The information they provide can be obtained and absorbed quickly with the ability to dive deeper for those who want to.
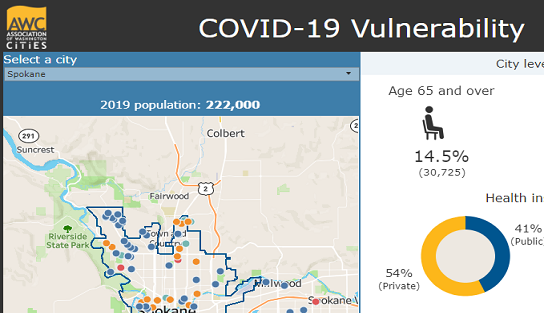
A data interactive by the Association of Washington Cities does this by shedding light on the vulnerability of cities both large and small in Washington State.
Based on known vulnerabilities (those who are ages 65+, diabetics, or smokers, etc.), the risk for each city is based on the unique demographics and characteristics of each city, showing the estimated total and share of the population for a variety of vulnerabilities.
In addition to vulnerabilities, it shows positive aspects, or where a city might be better prepared should a major outbreak occur locally. These include number of facilities and the beds they contain for nearby or local: hospitals, skilled nursing facilities, assisted living facilities, and adult family homes.
Other vulnerabilities include the total and share of the city population: with a disability, with health insurance, and the homeless population.
If you have friends or family living elsewhere across the state or find yourself in a must travel situation, you will likely find this interactive helpful and interesting.
-----
Urban Institute: Mapping America's Futures - Test Different Scenarios to See The Affect on Population Changes
by Trends Staff
One thing we can likely all agree on halfway through the year 2020 is very little appears average. Population growth or contraction is estimated using a variety of predictable variables so from one year to the next, there are not a lot of surprises. Over a decade, the increasing amount of time makes estimating population changes more difficult.
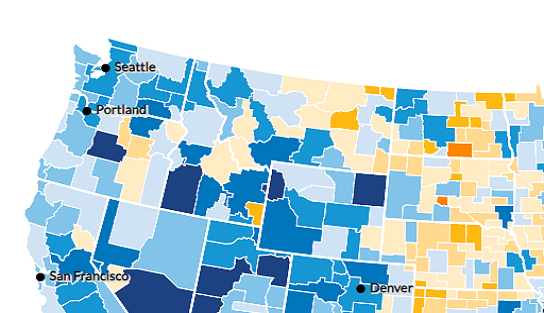
The Urban Institute’s Mapping America’s Futures allows you to change a few variables to see how the overall population might be affected.
The map begins with average rates and All Ages and Races. More specifically, options include possible scenarios of Low, Average, or High rates for Births, Deaths, and Migration. Map filters include four age groups (0-19, 20-49, 50-64, and 65+) and All Ages, as well as by four race categories (White, Black, Hispanic, and Other).
Commuting Zones (CZ) are unique, often crossing county and even state boundaries. CZ’s were created to best reflect local economies regardless of traditional geographical borders. There are 740 unique CZ’s offered in this tool.
Select an area by clicking on the map. This zooms into the selected CZ or state. Scroll down below the map to see age and race detail, and further down to see a breakdown of 18 unique age groups by race. Changes occurring from 2000 to 2010 are actual while estimating each decade through 2030.
The Kennewick Area CZ includes Benton, Columbia, Franklin, and Walla Walla Counties in Washington State and Morrow and Umatilla Counties in Oregon. One highlight of the Kennewick Area CZ is the projected population growth of 141,039 residents, or by 34.84% from 2010 to 2030.
While this tool was available before COVID-19, it can perhaps still inform by selecting Low for Births and Migration and High for deaths. However, we do not know what the final impact of the virus on the typical population changes occurring over a decade.
Yet, demographers write that due to the impact of COVID-19, U.S. birth estimates for 2021 and the foreseeable future, might see as many as one-half million fewer births annually. Ultimately, only time will provide answers to the overall impact, but the Mapping America’s Futures tool might provide us a sneak-peak more important now then when the Urban Institute released this tool a few years ago.
But the big question remains whether the larger (over 1 million) metro areas will change from typical population growth to a decrease, or if their smaller and mid-size counterparts start to see larger than predicted growth.
-----
Going into Uncertain Times for Public Health Funding
By Brian Kennedy and Dr. Patrick Jones
Since the outbreak of COVID-19, public health has been in the forefront of everybody’s mind. But what is it exactly and what does spending on its activities look like in Benton and Franklin Counties?
Spending on public health comes in a variety of forms. Largely comprised of the workings of the Benton-Franklin Health District, the programs and services provided are far reaching within the community. Not only is the health district taking lead on providing COVID-19 testing, but it is tasked with contract tracing of those infected, epidemiology, response and support for long term care facilities, and coordinating with hospitals and health care facilities in the allocation of COVID-19 resources. Further, with much information swirling around, the health district serves as the central source of definitive information to the public about the current state of the pandemic, symptoms to be on the lookout for, how and where to get tested, and ways of keeping safe.
Despite the COVID-19 pandemic taking center stage right now, the public health covers a wide swath of programs and services, ranging from keeping vital records such as birth and death certificates, to program services like Women, Infant, and Children (WIC). For a complete look at all the services provided visit here.
Knowing just exactly what public health does is important so we can evaluate the trends. Indicator 6.5.1 shows how funding for public health has changed over time. The Washington State Auditor’s Office keeps track of all local government expenditures using the Financial Intelligence Tool (FIT). Here we can look up any government entity, ranging from city and county governments to health and park districts. Using this tool, we can analyze how government spending has changed overtime in key areas such as public health.
In 2018, there was a total spending of nearly $10.1 million on public health services across Benton and Franklin Counties. While this includes any spending done by county and city governments within the two counties, a vast majority, 94%, comes from the Benton Franklin Health District. While $10.1 does sound like a lot of money, this accounts for just 3.1% of the roughly $339.8 million in total government expenditures carried out by all cities and counties within the metro area.
As the graph depicts, spending per capita between Benton and Franklin Counties and the State are not only quite different but they are moving in opposite directions! In 2018 per capita spending was just $35.1, almost half as much as it is statewide, at $62.8. In addition to the current, large discrepancy locally, spending has dropped by $4.3 per resident within the two counties, falling at a cumulative annual growth rate of about 1.3% since 2010. Washington on the other hand has grown by about 1.4% per year.
Indicator 3.1.1 shows the per capita personal income earned locally and statewide. This trend measures the total personal income (TPI) earned by all residents, including wages, investments, pensions, and government transfer payments. It is clear there are great differences in the levels of income locally and those across the state, largely swayed by the metro areas west of the Cascades. Because of this, we can look at public health expenditures per $1,000 of total personal income allowing us to account for the differences between the state and here. In other words, this approach allows a comparison beyond a per capita basis. If incomes are lower in a particular jurisdiction than in the benchmark, we would expect local government expenditures to be lower as well
In 2018, about 80 cents were spent on public health per every $1,000 of personal income in Benton and Franklin Counties. Here, the Washington average is about $1 per $1,000 TPI. So when accounting for the income difference, the two counties are still trailing the state but, in this case, not nearly as much. The State is only about 25% higher than the two counties as opposed to nearly double.
Because King, Peirce, and Snohomish Counties alone account for over 50% of the population the westside metro areas heavily influence the state rates. Other Eastern Washington Metro areas may provide better benchmarks.
Walla Walla Trends Indicator 4.4.6 and Yakima Valley Trends Indicator 7.5.1 track similar data and show that Benton and Franklin Counties fund public health at a higher rate than comparable eastern Washington metro areas. Walla Walla County comes quite close, however, falling behind Benton and Franklin Counties by just $0.7 per capita and $0.1 per $1,000 TPI in 2018. However, Yakima County falls well short of Benton and Franklin Counties by $24.6 per capita and $0.6 per $1,000 TPI in the same year. So, while it looks like locally public health isn’t being funding well, compared to some other Eastern Washington metros, the region is doing well.
In the uncertain times we are facing, keeping an eye on funding for public health allows residents to see if we are well equipped to handle times of crisis. While funding has slowly declined overtime following this trend into the future will be important to watch. The additional dollars that have flowed to the public health in the wake of the pandemic will undoubtedly produce higher expenditures in 2020. (They won’t show up in the Trends for another year, however.) A big question will remain whether these increases will be sustained into 2021 and beyond. From all the forecasts we read, the virus will be with us in 2021 and perhaps 2022. And virologists tell us that other viruses may not too far behind. Will this crisis lead to an increased appreciation of public health, and consequently its funding?
-----
Home Internet Connections by Type: Quality and Speed is Now More Important
By Dr. Patrick Jones
A few months ago, virtual interactions were in the ascendancy in the business world. But not the norm. Enter the corona virus pandemic. Now many of us have pivoted to a professional life filled with Zoom, Team, Google Meet, or any number of other versions of online gatherings. Without these, it is likely that the wheels of commerce would have ground even more slowly in the face of covid-19-induced shutdowns.
To effectively communicate in this way, however, one needs computers and fast connections. Let’s assume that most residents in the greater Tri Cities have access to online life – a computer, tablet or smart phone. But those devices are no guarantee of the ability to conduct some form of virtual life. For that broadband is called for.
How do the two counties fare by this measure? Thanks to a fairly recent Census set of questions on the American Community Survey (ACS) and tracked by Indicator 0.2.4 in the Trends, we have a good idea. The short answer: not too great, but not too bad. In particular, for 2018, Census estimated that about 81% of households enjoyed a broadband connection. For the three years in which the ACS has asked this question, there has been little movement.
As we can easily observe, the second most common type of internet connection is cell service, at nearly 12%. Other types make up the small difference.
One can further observe that this rate is considerably lower than that of Washington. For 2018, the share of households with broadband in the Evergreen state was nearly 86%. Over the three-year period, this share hasn’t changed either. Interestingly, broadband penetration in the greater Tri Cities largely tracks that of the U.S.
Not surprisingly, a difference exists between the two counties. As a click on the radio buttons on the graph of Indicator 0.2.4 shows, the difference between the two-county average and Franklin County amounted to about five percentage points in 2018. In contrast, Benton County ran ahead of the two-county average by about two percentage points.
Why this distribution holds is both puzzling and understandable. First, Franklin County’ population is actually more urban/less rural than Benton’s. Washington State’s Office of Financial Management estimated for 2019 that the incorporated population in Benton was about 18% versus 13% in Franklin. On the other hand, as Indicator 3.1.2 demonstrates, incomes are typically lower in Franklin than in Benton Counties. For 2018, the ACS reported Benton County’s median household income at about $68,000, while in Franklin it stood at about $60,000. Broadband service definitely carries a price tag and it is likely that many households simply cannot afford it.
While not a part of the indicator’s Download Data spreadsheet, data pairing internet connection with household income and race & ethnicity are available from Census. The first pair confirms the hypothesis above, showing a positive connection with income and internet connectivity. More specifically, this data set, Public Use Microdata Areas (PUMA) shows that for the most recent 5-year period (2014-2018), the percentage of households with income at or below the Federal Poverty Level (FPL) was more than three times (7% vs. 2%) than those with middle-to-high incomes to have no internet connection at all.
A similar divide exists between Latino and non-Latino households, according to the PUMA data on the two counties. The share of Latino households without any internet connection was more than twice as high as the share of non-Latino households, 10% versus 4%. Of course, this dichotomy largely reflects the household income data.
Then there is the possible issue of the local service providers’ willingness to extend broadband to residences. Yet, between cable, telecom and satellite and a PUD, the Tri Cities sport nearly a dozen providers of broadband. Supply of copper or fiber appears available.
It will not surprise this observer of the Tri Cities that in the aftermath of the pandemic, broadband penetration will rise. If the pandemic has taught us anything beyond social distancing and the need for better preparedness, it is that both businesses and households can function relatively well in a virtual world.
-----
Travel and Tourism Spending Growing: Yet a Little Behind the State per Capita Benchmark
By Scott Richter and Dr. Patrick Jones
As the old saying goes, “When preparing to travel, lay out all your clothes and all your money. Then take half the clothes and twice the money.” While this is probably more necessary the farther someone travels from home, it also reflects on how traveling, tourism, and vacationing is more expensive than staying home even when the distance is relatively short.
It’s no surprise then that tourism is often an important part of a community's local economy. Tourism goods and services are, by definition, purchased by people from outside the community, so their spending represents new dollars injected into the local economy.
The money is “new” in the sense if people did not stop for gas, lodging, or a meal (or any of the travel purposes listed further in this article) it basically would leave goods and services unsold locally. If not here, travelers and tourists will very likely still purchase gas, lodging, and meals, but elsewhere.
While tourism is an important part of a local economy, it is more transient than most sectors like manufacturing. Local manufacturers might be impacted by market factors from anywhere in the world they sell their products, and less impacted by the local economy. In other words, tourism is always selling local.
The best measure of the success of a community's efforts to increase general tourism is the total expenditures on hotel/motel stays, restaurants, transportation, retail shopping, tours, campground visits, museum visits, etc. Although growing, tourism is a competitive market. Campaigns are important tools to attract travelers or tourists to our area, and their money.
Looking at Indicator 1.2.1, Total Direct Travel and Tourism Spending & Spending per Capita, we see in Benton and Franklin Counties combined, annual spending has increased nearly every year in the series. This is true for total travel and tourism spending, as well as travel and tourism spending per capita.
Purpose of travel counted in this indicator include all reasons, including for business, pleasure, shopping, business meetings, medical, education, and personal.
Visitors are classified by the type of accommodations they purchase. Hotels, motels, B&B’s, campgrounds, private homes (staying with friends or relatives), vacation homes, and day travelers (not purchasing overnight accommodations).
Spending in the following categories are included: accommodations, food & beverage service, recreation, transportation, and all other visitor related commodities. Spending must occur in the destination county. Detailed methodology can be found here (see Appendix A starting on page 53).
More specifically, during 2018, direct travel and tourism spending in:
Benton & Franklin Counties combined was $672.1 million, increasing from $282.8 million, or by 137.7% since 2000.
Benton County was $409 million, increasing from $182.1 million, or by 125% since 2000 (view individual counties on trends website or download data below).
Franklin County was $263.1 million, increasing from $100.7 million, or by 161% since 2000.
Washington State was $24.425 billion, increasing from $11.484 billion, or by 113% since 2000 (Direct Travel and Tourism Spending - click to download data).
During 2018, the per capita amount of direct travel and tourism spending in:
Benton & Franklin Counties combined was $2,318, increasing from $1,488, or by 55.8% since 2000.
Benton County was $2,072, increasing from $1,278, or by 62% since 2000.
Franklin County was $2,843, increasing from $2,114, or by 35% since 2000.
Washington State was $3,288, increasing from $1,948, or by 69 since 2000.
While the coronavirus will certainly affect this indicator when we see the 2020 data in a few years, one bright side is people are still travelling even if a little less than before. While important, Benton and Franklin Counties have economies not heavily dependent on travel and tourism perhaps helping with the overall economic recovery compared to less diversified economies.
-----

5-Questions with: Karl Dye
President & CEO, Tri-City Development Council (TRIDEC)
Q1) TRIDEC has been in existence for more than four decades as the lead economic development agency for the metro area. So many readers are familiar with the organization’s general goals. Have those goals shifted since the outbreak of the pandemic?
A1) The three strategic objectives of TRIDEC are Economic Diversification, Federal Advocacy and Creative Leadership. While TRIDEC started our work in 1963 with Federal Advocacy and has always focused on Economic Diversification, since the beginning of March most of our work has fallen into the Creative Leadership category. From joining forces with our community partners to create the Tri Cities Open and Safe Coalition to standing up business grant programs for Washington Department of Commerce and our local jurisdictions, TRIDEC has concentrated our efforts on making sure our economy recovers quickly.
Q2) As an economic development agency, TRIDEC undoubtedly has short list of key performance indicators for its work. Can you share some of these?
A2) From the beginning, TRIDEC has measured the outcome of our work in job growth. We still use this as a key indicator but have evolved to include economic diversity. Since the Manhattan Project and World War II, the federal government has been a major economic driver in the Tri-Cities. Past changes in administrations and policies have had an inordinate impact on our economy because we lacked the diversity and mix of industries that we have today. The other measurement is growth of the tax base, both in real property and sales tax. These are key indicators for our partner cities, counties and ports and allow them to make key infrastructure investments for the next phase of growth.
Q3) Benton Franklin Trends now holds nearly 180 measures of life in the two counties. Which of these are of greatest value to TRIDEC?
A3) While it may seem counter-intuitive for an economic developer to talk about community indicators rather than the traditional jobs and unemployment, measurements such as income distribution, real estate affordability and poverty are more valuable for TRIDEC and the Tri-Cities’ future. Our ability to attract new companies and help local companies grow is related to the quality and diversity of our community. The future of economic development is placemaking and attracting the talent and companies that complement our community.
Q4) You are native to the inland Pacific Northwest but new to the greater Tri Cities. As you look at the non-economic measures of life here captured by the Trends, are they any that jump out at you?
A4) The Poverty category and Real Estate are two that are different from the last two communities our family has lived. Compared to Sandpoint, Idaho and the Lewis-Clark Valley of Washington and Idaho, the share of the population living in poverty is lower. While any poverty is too much, it shows the vitality and strength of the Tri-Cities population. Real Estate is also a dynamic driver of the community in the level of permits for residential construction. While the indicators don’t include affordability, the number of permits per year for the whole community shows that there are great housing choices for our workforce.
Q5) For many years, you’ve been a leader in economic development efforts. Over those years, more data have become available to practitioners. How has the field changed in response to these new sources of information?
A5) My predecessor at TRIDEC, Carl Adrian has been quoted as describing economic development as a process. Consistently using the best practices in our profession will yield good results over time and that has definitely been true here in the Tri-Cities and is the history of TRIDEC. Moving into the future, we are working on incorporating great data sources like Benton Franklin Trends into these same processes to not only provide realistic deliverables for our community and partners but also to shape our strategies and tactics as we recover and rebuild from the impacts of COVID.